Python pyecharts绘制水球图的方法是什么?
AI 摘要 / TL;DR
小编写这篇文章的主要目的,主要是给大家去做一个详细解答,介绍的内容是关于Python pyecharts的一些详细内容,给大家讲解关于如何绘制水球图等相关事宜,具体的内容,下面给大家详细解答。 水球图 水球图首先是动态的效果,像水流一样波动,所以看起来比较的舒服,一般用于业务里面的完成率,其实和之前的仪表盘有点类似,但
来源: https://www.ucloud.cn/yun/128288.html 作者: 89542767 发布日期: 发布于2022-11-09 14:18
小编写这篇文章的主要目的,主要是给大家去做一个详细解答,介绍的内容是关于Python pyecharts的一些详细内容,给大家讲解关于如何绘制水球图等相关事宜,具体的内容,下面给大家详细解答。
水球图
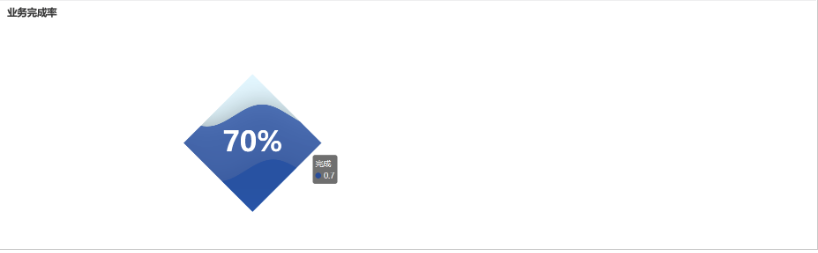
水球图首先是动态的效果,像水流一样波动,所以看起来比较的舒服,一般用于业务里面的完成率,其实和之前的仪表盘有点类似,但是我个人绝对水球图更加的好,因为看起来比较的炫酷。
  from pyecharts import options as opts
  from pyecharts.charts import Liquid
  from pyecharts.globals import SymbolType
  c=(
  Liquid()
  .add("完成",[0.7,0.3],is_outline_show=False,shape=SymbolType.DIAMOND)
  .set_global_opts(title_opts=opts.TitleOpts(title="业务完成率"))
  .render("菱形水球图.html")
  )
双水球图显示
  from pyecharts import options as opts
  from pyecharts.charts import Grid,Liquid
  from pyecharts.commons.utils import JsCode
  l1=(
  Liquid()
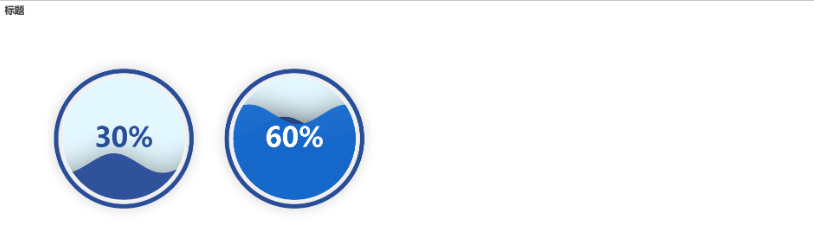
  .add("lq",[0.6,0.7],center=["60%","50%"])
  .set_global_opts(title_opts=opts.TitleOpts(title="标题"))
  )
  l2=Liquid().add(
  "lq",
  [0.3],
  center=["25%","50%"],
  label_opts=opts.LabelOpts(
  font_size=50,
  formatter=JsCode(
  """function(param){
  return(Math.floor(param.value*10000)/100)+'%';
  }"""
  ),
  position="inside",
  ),
  )
  grid=Grid().add(l1,grid_opts=opts.GridOpts()).add(l2,grid_opts=opts.GridOpts())
  grid.render("双水球图显示.html")
正方形水球图
其实只需要变动一下参数即可,和最开始的那个差不多。
  from pyecharts import options as opts
  from pyecharts.charts import Liquid
  from pyecharts.globals import SymbolType
  c=(
  Liquid()
  .add("lq",[0.7,0.7],is_outline_show=False,shape=SymbolType.RECT)
  .set_global_opts(title_opts=opts.TitleOpts(title="标题"))
  .render("正方形.html")
  )

圆球水球图
  from pyecharts import options as opts
  from pyecharts.charts import Liquid
  c=(
  Liquid()
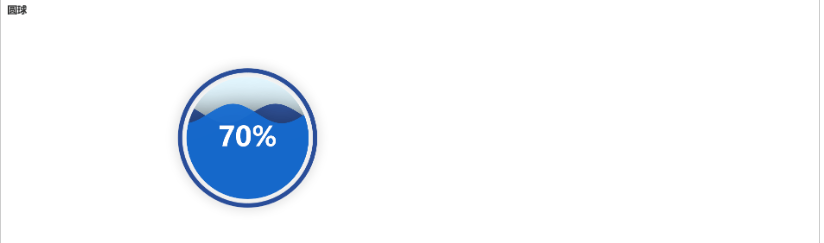
  .add("lq",[0.7,0.7])
  .set_global_opts(title_opts=opts.TitleOpts(title="圆球"))
  .render("圆球.html")
  )
数据精度水球图
  from pyecharts import options as opts
  from pyecharts.charts import Liquid
  from pyecharts.commons.utils import JsCode
  c=(
  Liquid()
  .add(
  "lq",
  [0.3254],
  label_opts=opts.LabelOpts(
  font_size=50,
  formatter=JsCode(
  """function(param){
  return(Math.floor(param.value*10000)/100)+'%';
  }"""
  ),
  position="inside",
  ),
  )
  .set_global_opts(title_opts=opts.TitleOpts(title="标题"))
  .render("数据精度水球图.html")
  )

炫酷水球超级好看
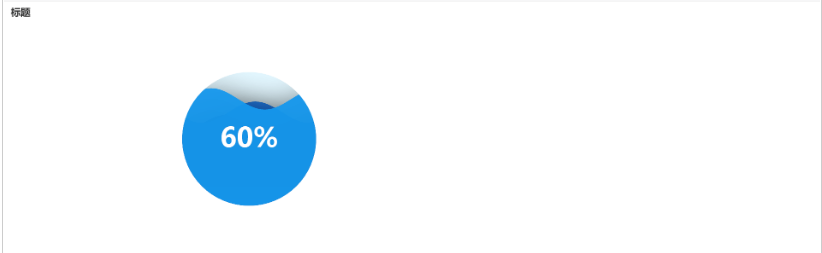
感觉这个颜色搭配还是不错的
  from pyecharts import options as opts
  from pyecharts.charts import Liquid
  c=(
  Liquid()
  .add("lq",[0.6,0.7,0.8],is_outline_show=False)
  .set_global_opts(title_opts=opts.TitleOpts(title="标题"))
  .render("无边框水球图.html")
  )
综上所述,这篇内容就给大家介绍完毕了,希望可以给大家带来帮助。